TensorBoard: Visualizing Models and Actions
📈 Built-in TensorBoard
TensorBoard is built-in to SLM Lab. It will record all of the metric variables already logged to the terminal output, as well as the PyTorch model graph, model parameter histogram, and action histograms. All of these are done automatically during checkpointing using a writer in agent.body. This allows for richer diagnosis of the network and policy, e.g. by seeing if the distributions shift over the course of learning.
Tensorboard event files are saved to the log/ folder in the output data. During/after a run, you can launch TensorBoard for diagnosis:
tensorboard --log_dir=dataNote that it may take some time for TensorBoard to parse the event files, which can be quite large. You can also speed it up by providing a more specific folder for the command, e.g. --log_dir=data/a2c_gae_bipedalwalker_2019_10_14_223906/log so that it does not read from other folders.
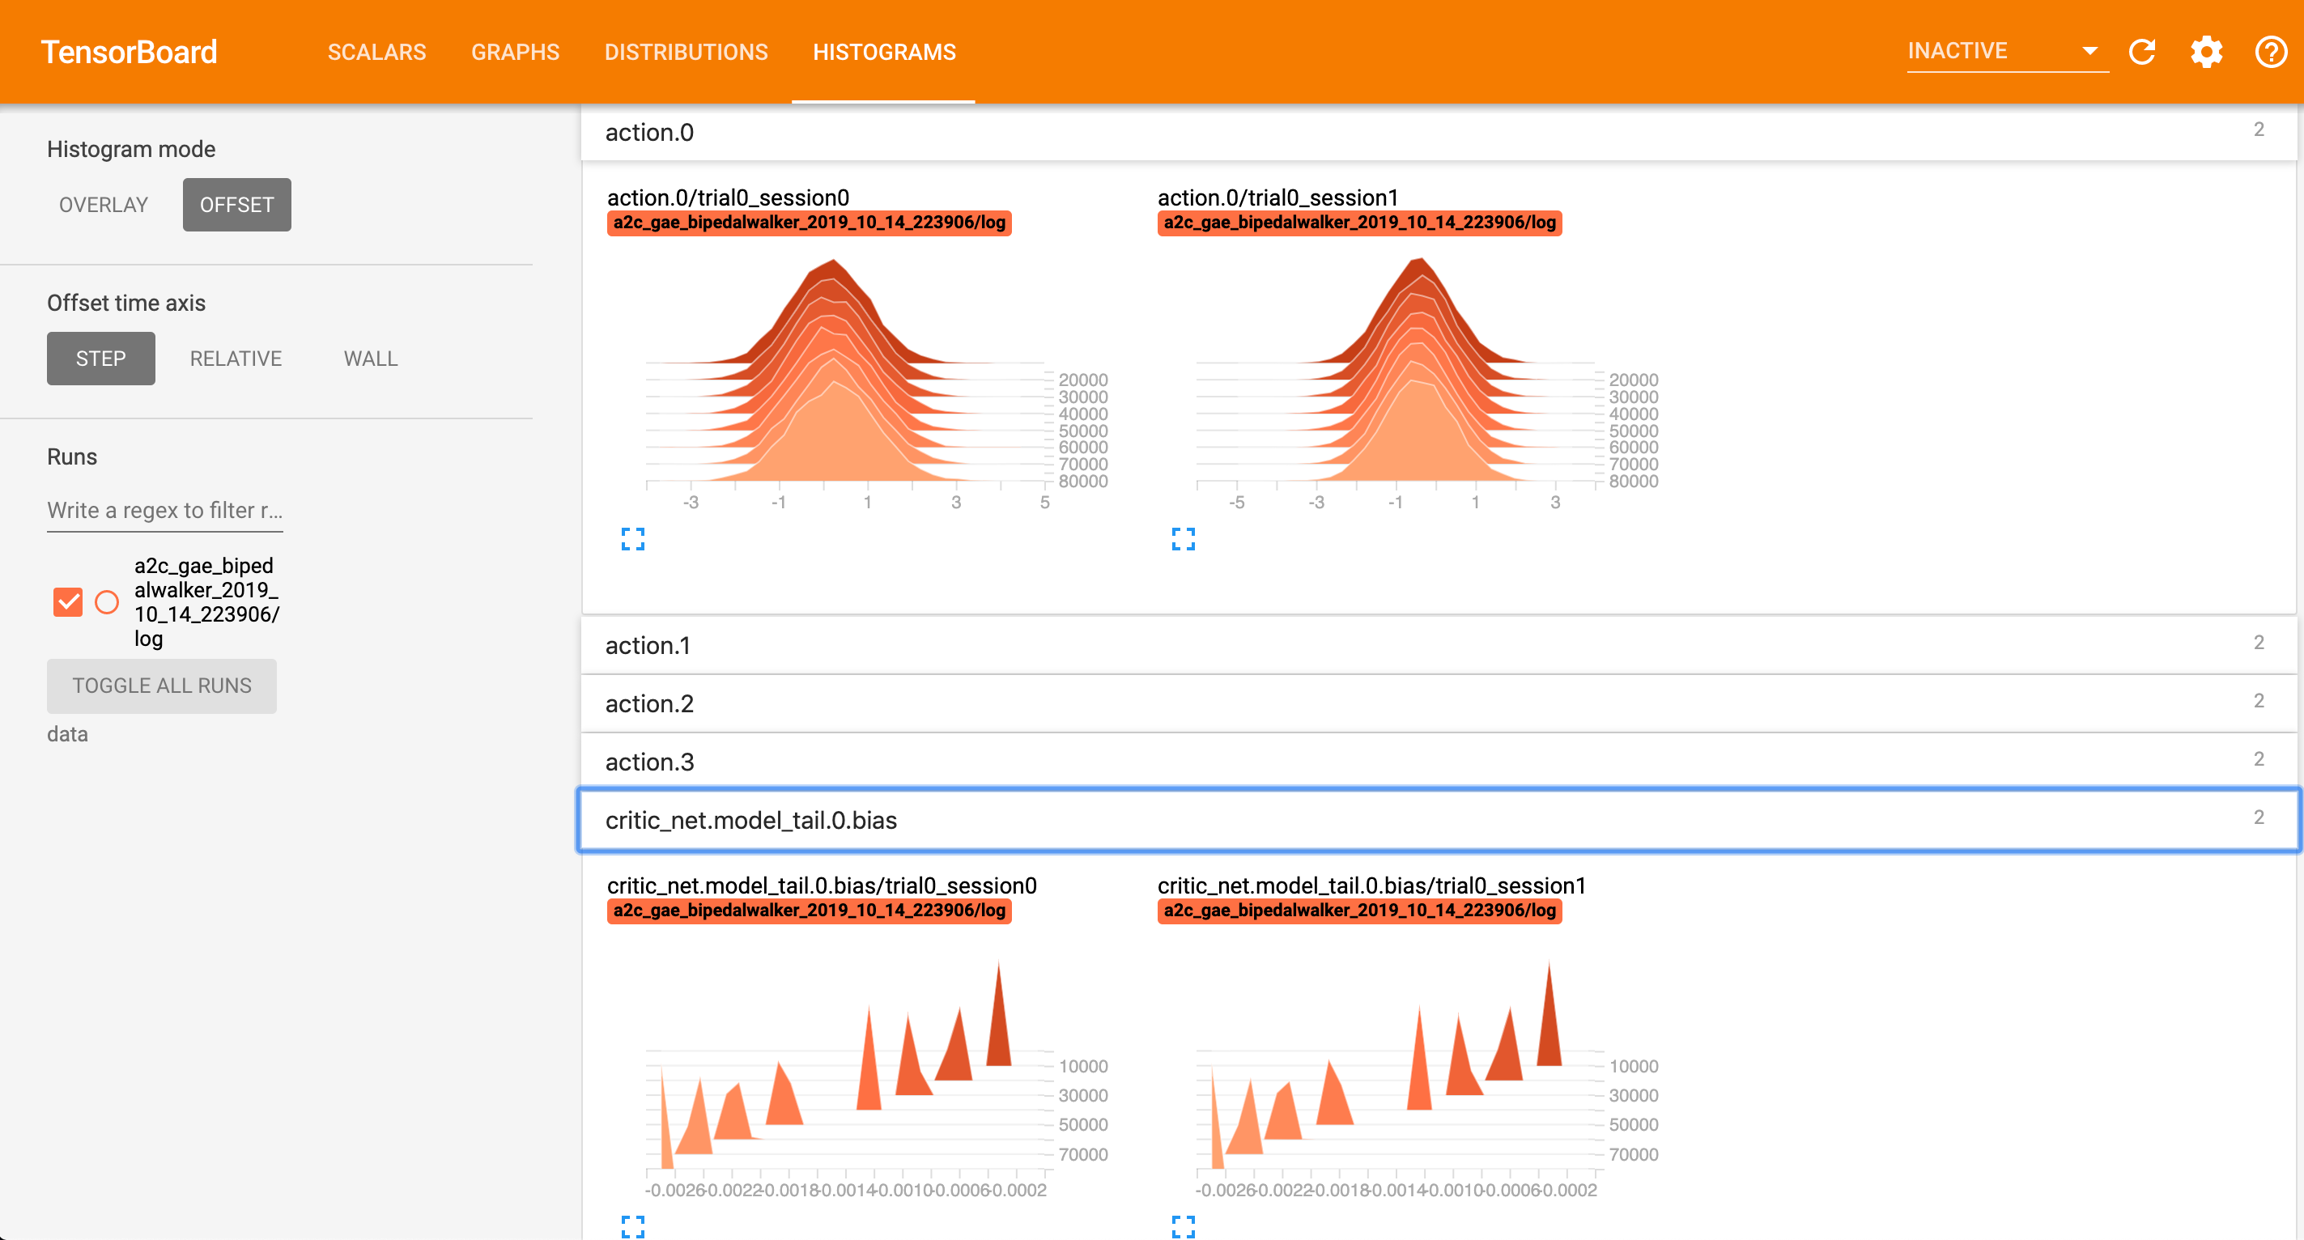
Then, go to localhost:6006 on your browser, and you should see the TensorBoard page:

The histogram tab is useful for revealing the distributions of the actions. In the example above, BipedalWalker has 4 continuous actions, hence there are 4 groups for plots for visualizing the value distributions of these 4 actions across different trials and sessions. Likewise, all the model parameters of an agent is also recorded as value distributions of the parameters of their layers.
In the histograms, the vertical axis (coming out from the page) is the number of frames during checkpoints. As an agent learns over time, we should see the distributions changing in shape and shifting locations.
Last updated
Was this helpful?